       
|

|
  
|

|
 Screenshots

|
|
|
|
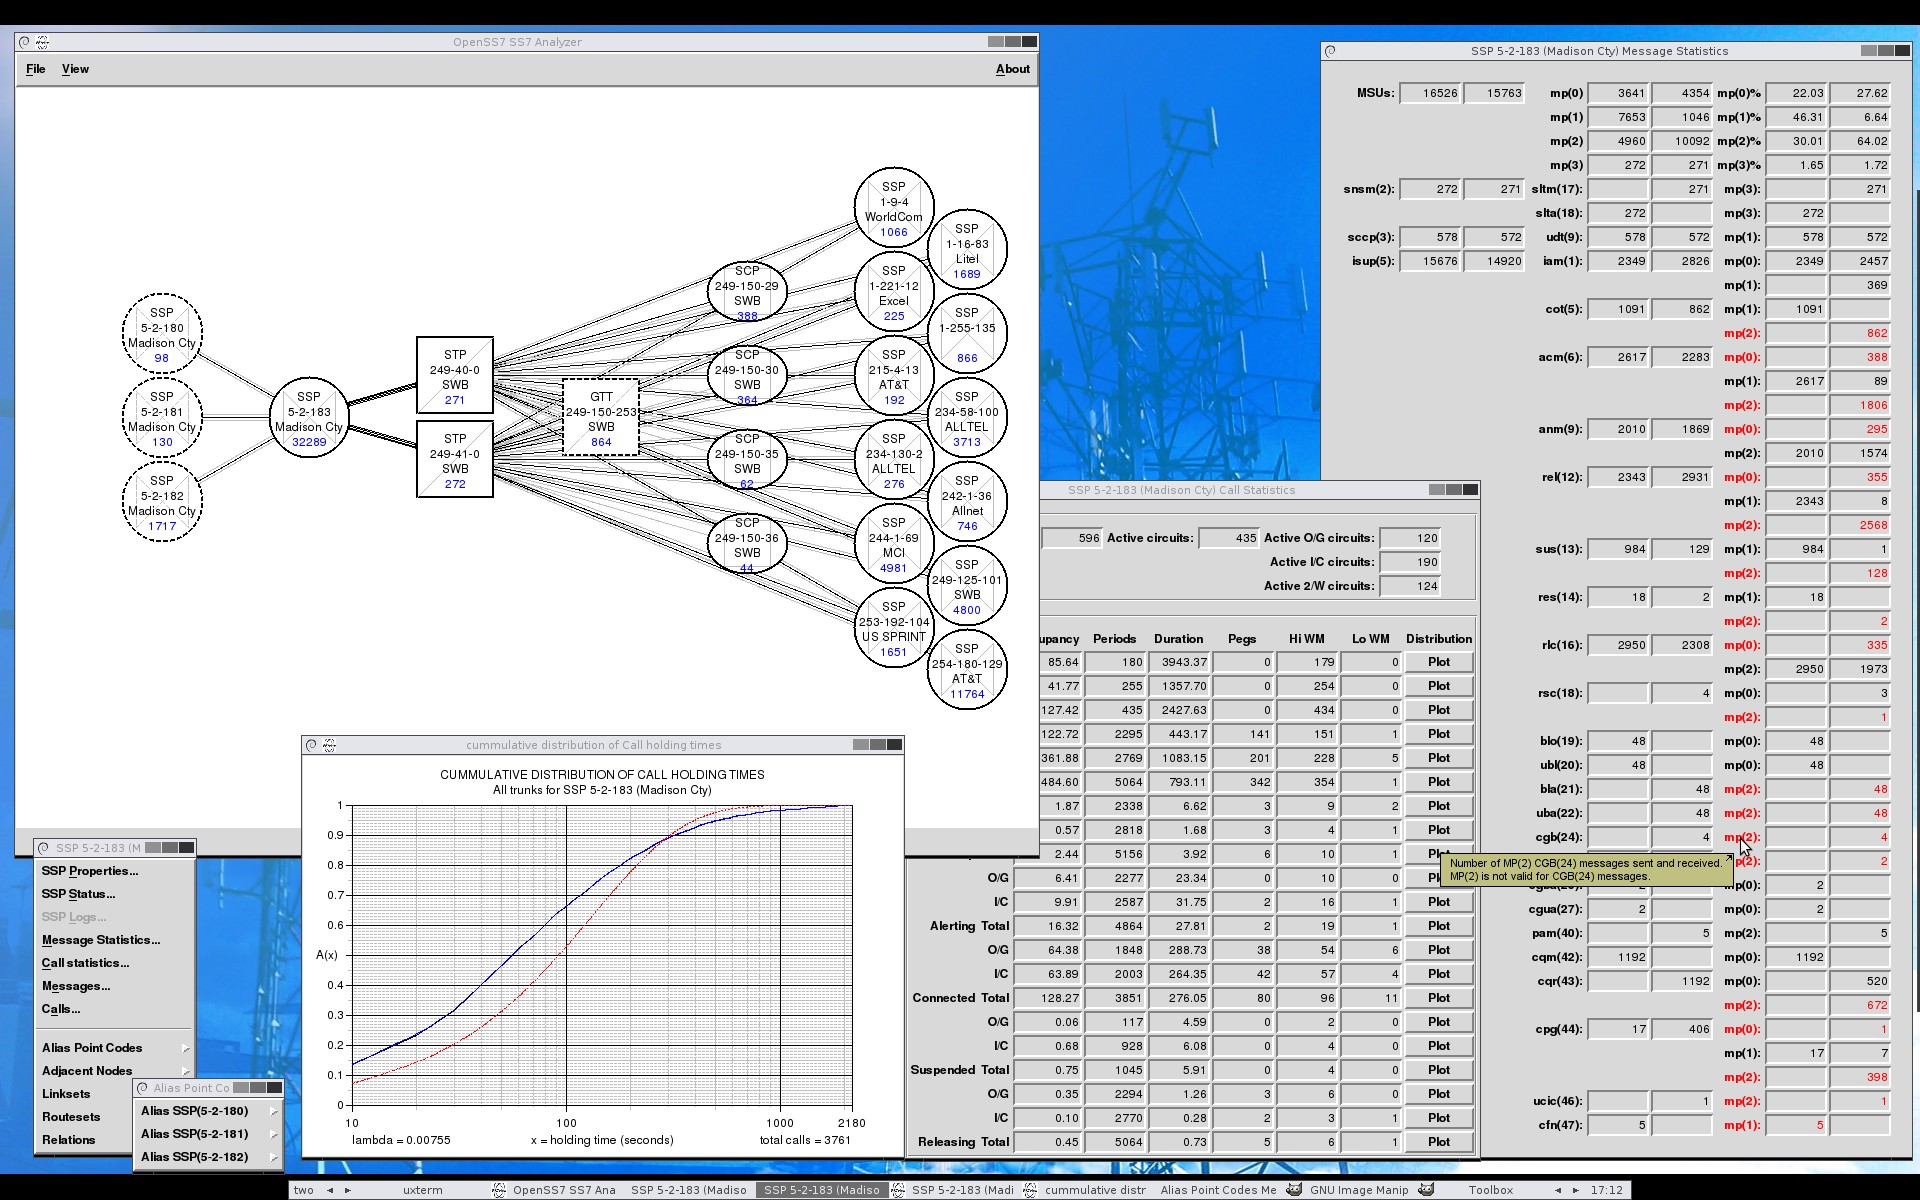
An image of some of the tools available in the SS7 Analyzer.
|
upper left:
|
SS7 signalling node network layout. Automatically detected and composed.
All graphics have context-sensitive menus.
|
|
left lower:
|
Graph showing the cummulative distribution of call holding times.
|
|
bot center:
|
Call and call state statistics. All distributions and cummulative
distributions for call states can be plotted.
|
|
right:
|
SS7 message statistics. As you can see from the sample data set, someone
is messing with their ISUP message priorities.
|
|
|
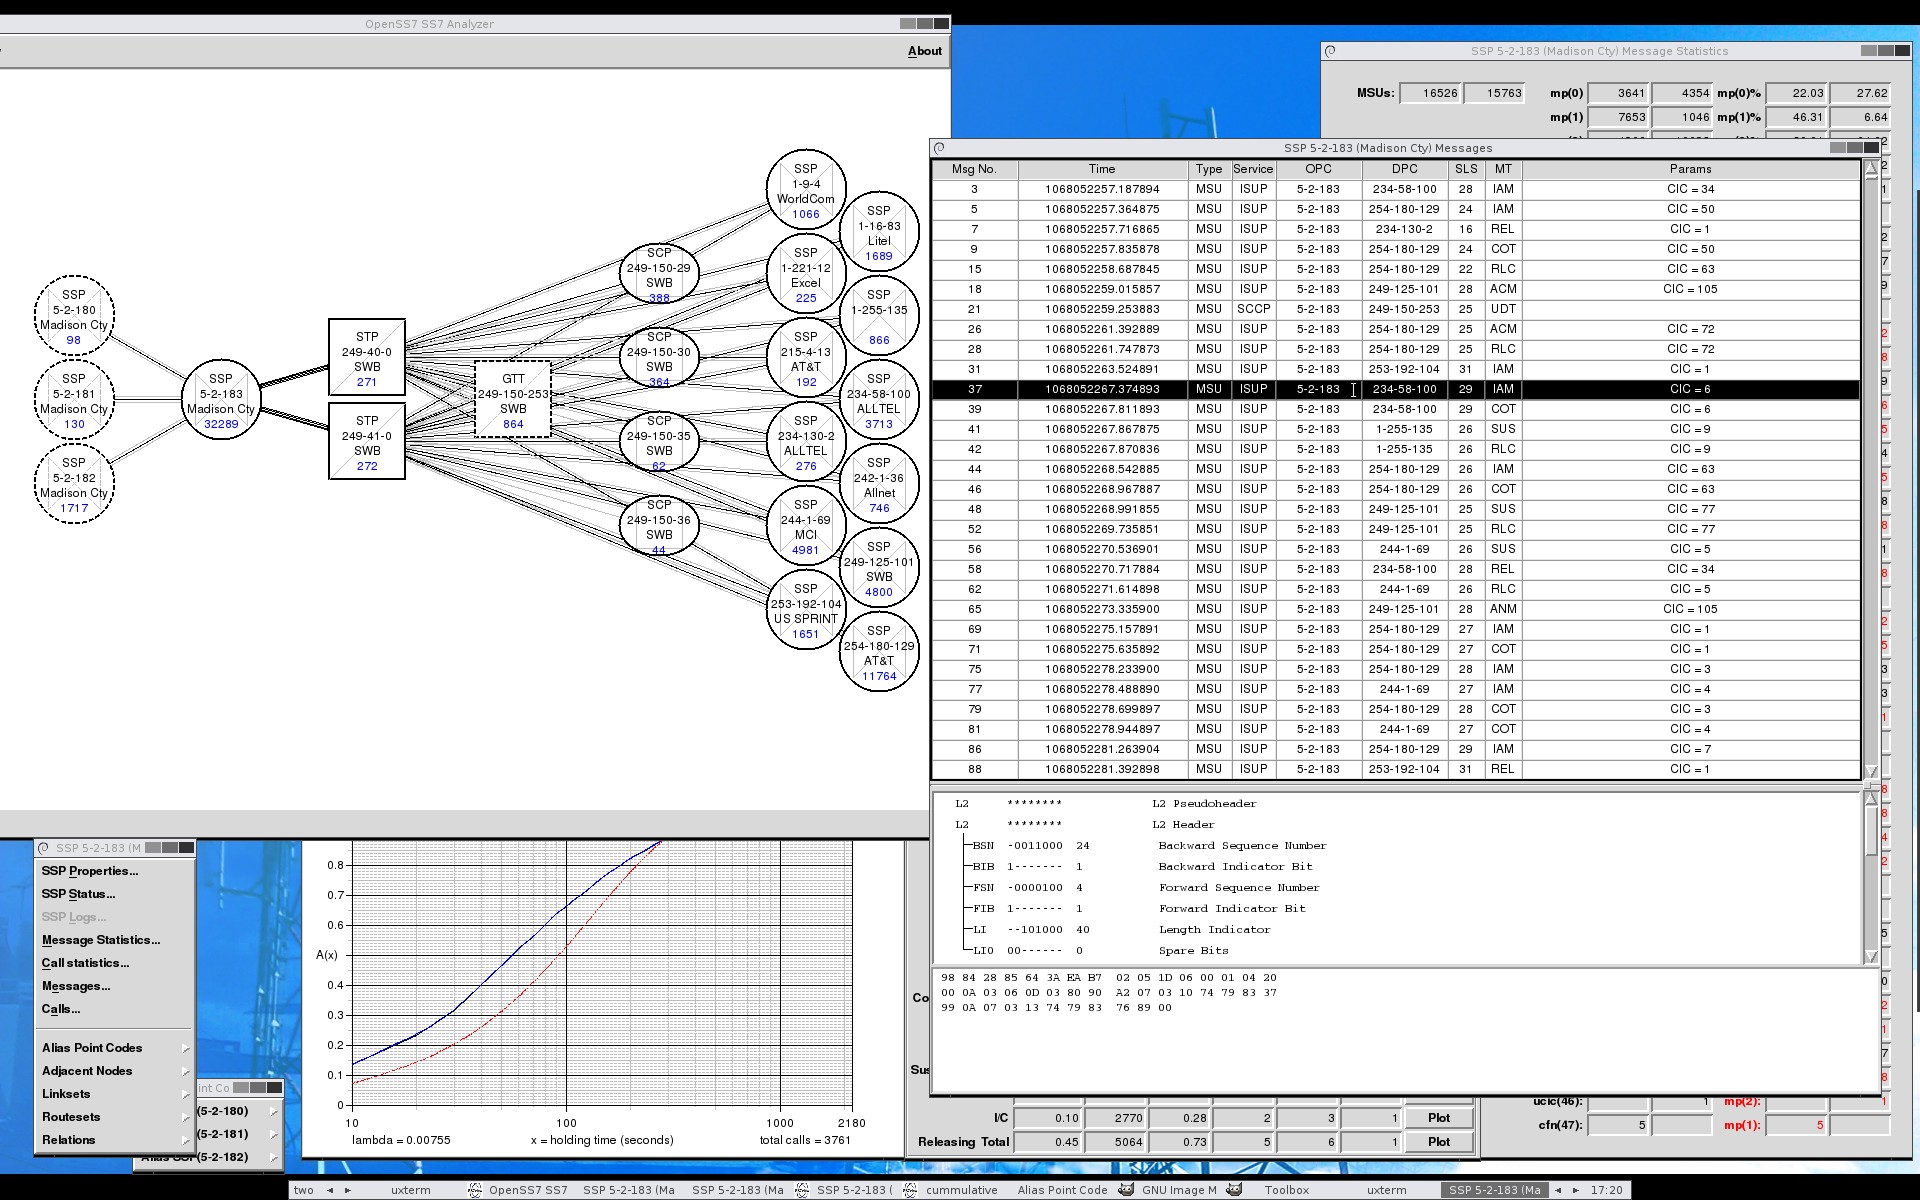
Another image of some of the tools available in the SS7 Analyzer.
|
right:
|
SS7 message dissector: down to the FISU.
|
|
|
|

|
|
|
|
Home
History
FAQ
Blog
Contact
Support
© Copyright 2012, 2013 OpenSS7 Corporation. All rights reserved.
|
|
|